

Building internal tools to benchmark energy footprints of cloud usage has become critical to deliver energy savings and digital sustainability. ��ѿ��ý Research & Development's has developed a tool called LECCIE that allows teams to monitor and minimise their cloud footprints.
Increasing energy and climate impacts of cloud computing services are becoming a global topic of discussion. Even though the global energy concerns for data centres are driven by the rapid growth of artificial intelligence, cloud computing services are becoming ubiquitous within the media and broadcast sector. The ��ѿ��ý, for example, relies on both on-premises and cloud computing to deliver the engineering and technological services behind its global media operations. Being able to estimate the energy footprint of computing is a critical requirement, both for immediate sustainability targets and long-term net zero transition plans.
Organisations using on-premises servers can often monitor the energy footprint of their compute infrastructure. However, large-scale cloud computing service providers (often called hyperscalers) continue to keep verifiable energy footprints as closely guarded secrets. Currently most cloud computing service providers (including AWS) do not provide energy estimates for their consumption by consumers. With increasing environmental concerns, regulatory pressure, and passion within the software development community for delivering sustainable compute, a lack of energy estimates for cloud services from their respective providers has become a difficult problem. This complicates efforts to understand the scale of computing associated energy footprints at team, product, service, or organisation levels. Without clarity on this, sustainability monitoring, and interventions to reduce climate impacts also remain difficult to achieve.
The challenge
Energy estimates for cloud computing remain complicated and uncertain. Increasing adoption of Gen AI has triggered scrutiny of data centre energy footprints and future implications. But most global data centre energy estimates that have emerged through a range of academic and industry reports remain unverified due to a lack of primary data from cloud service providers (). For example, recent estimates for global data centre energy differ significantly across state-of-the-art academic publications (, , , ).
There is an increasing regulatory pressure for emission disclosure and public expectations of media organisations to deliver their net zero targets. However, there is a continued lack of energy estimates for both a specific cloud product or service and total compute energy for a consumer and a lack of transparency is extremely frustrating. Even though some cloud service providers have released user dashboards for carbon footprints, their carbon accounting approaches and carbon neutrality claims make such dashboards useless from energy monitoring and sustainability interventions perspectives.
Organisational need for cloud energy footprints
Most engineering professionals take sustainability very seriously within their computational decisions. Engineering teams are keen to have tools to benchmark their energy performance over time as they change and/or add new features to their products and services. Designing sustainable services and products requires datasets that can help benchmark performances. A lack of energy estimates for their cloud usage make decisions mainly dependent on the claims of cloud providers, which lack transparency and often include conflicts of interest. For example, reports on cloud sustainability that come from third party consultants are often without any openly available, verifiable power data while also being paid for by the cloud providers. Even though reports like these are developed with good intentions, they lead to a lack of credibility for engineering teams to rely on their sustainability decisions.
Also, with data centre energy becoming a highly contested topic regarding sustainability in the information and communications technology sector, there is increasing pressure and interests for benchmarking organisational energy footprints for their cloud usage. Even though contractual relationships may make cloud associated emissions indirect greenhouse gas (GHG) emissions in an organisation's value chain (i.e. Scope 3 emissions within organisational sustainability reporting frameworks), the need for its accurate estimation is urgent and critical. With a lack of accurate and reliable cloud energy and emission estimates from hyperscalers, it is now crucial to develop in-house tools that allow organisational cloud energy footprints to be monitored and benchmarked for performance and efficiency. Even if these are approximations, they can still play an important role in cost and energy savings of computing services.
The in-house cloud energy tool from a public project
There are ongoing public efforts to make cloud usage energy visible for engineering teams. One notable effort is the , where several volunteers and enthusiasts have devoted their time and expertise to bring data together that can help deliver energy and emission estimates for cloud usage.
We considered whether we could use the CCF project. However, the CCF project is designed to run in a single cloud account and/or service and the ��ѿ��ý makes use of of . Deploying this to each account would be a logistical challenge, and introduce unnecessary duplication of resources, costs, and potential security issues. It would only supply information on a per-account basis, which wouldn’t help with monitoring overall impacts and trends of the ��ѿ��ý’s use of AWS. In addition, we have many custom tags attached to our AWS resources, and it teams would benefit from being able to granularly monitor their deployments.
Luckily, the CCF project , which allows you to use the underlying data and roll-your-own processing and visualisation tools.
And that’s what we did - which resulted in a tool we called Leveraging Estimates of Cloud Computing’s Impact on the Environment, or LECCIE, for short.
Creating the lookup table
This wasn’t as smooth a process as could be expected. Rather than producing a lookup table for each instance type that CCF supports, it instead only generates lookup table entries for instances you can give examples of. That is great if you have plenty of examples of using an r5.16xlarge in eu-west-1; but if you don’t have an example in eu-west-2 as well, then you’re out of luck if you want that in the future.
To get around this, we prepared billing data covering the previous year and fed this into the create-lookup-table command. This means that the vast majority of AWS usage is covered, but new instances, and instances in new regions, are not. Additionally, any changes to the CCF methodology would require regeneration of the lookup table, although this is still simpler than updating CCF across every AWS account. Care also needs to be taken when harmonising the billing data units with the units of CCF methodology (e.g. mismatching Hrs with Months) to make sure all estimates are in the same units. Where there was an unsupported usage type that was popular amongst ��ѿ��ý accounts, we made approximations to the nearest supported hardware type (matched by CPU/GPU count, RAM, and CPU architecture).
However, approximations could not be made for our video transcoding through AWS Elemental. The billing data for transcoding is available in output minutes of transcoded video, which doesn’t give you much indication of the amount of time/energy used to perform a particular transcode. The importance and scale of transcoding energy across the video streaming value chain has been widely acknowledged across media organisations that rely heavily on this process. Transparency on time and/or compute (and associated hardware type) needed to transcode videos through AWS Elemental can help achieve energy/emission estimates but this needs support from cloud service providers.
Data processing
Now that we had a lookup table, it was time to start processing data. We set up an Athena query to generate billing data each day. After finding some anomalous patterns in our data, we realised we had to regenerate the previous seven days’ data each morning, as some items take up to a week to be reflected in the data. These queries also included all the custom tags we have about teams, projects, and services.
We stored the results of these queries in an S3 bucket (AWS Simple Storage Service (S3), which provides object-based storage for storing files and data, which was set up to trigger our parser Lambda function.
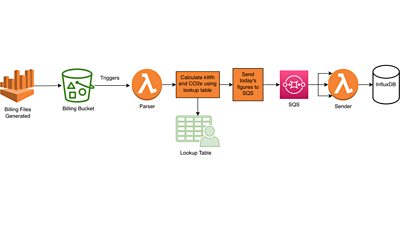
This Lambda then goes through each line in the billing data and finds the kWh and CO2e per unit usage figures from the lookup table. This is then enriched with data such as Lat/Lon coordinates of AWS regions, as well as summary statistics.
Data storage
We decided to use InfluxDB to store our data. This is because it is optimised for time-series data, which was important as most of our queries were going to be based on date ranges. This meant that we had to convert our data into ‘line protocol’ before sending it off to the database. At this point, we are dealing with quite a significant amount of data, so to not overwhelm the database or time out the lambdas, the line protocol data was sent to an SQS queue.
This queue was attached to a dedicated sender Lambda, which just takes batches of line protocol off the queue, compresses it, and sends it off to the database.
Visualisation
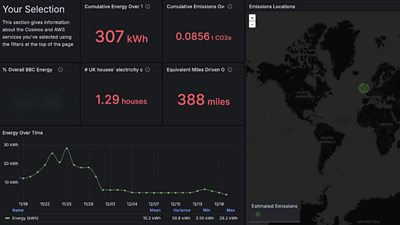
For several products and services, benchmarking allows engineering teams to look at performance from several perspectives including, for example, hours spent by audiences on their product or service, or the usage of specific software platforms for internal operations. All the custom tags in our billing information meant we could make a highly customisable dashboard, letting teams drill into their energy usage across accounts and projects.
For example, here’s the amount of energy used by the Parser and Sender lambda over a period of two weeks:
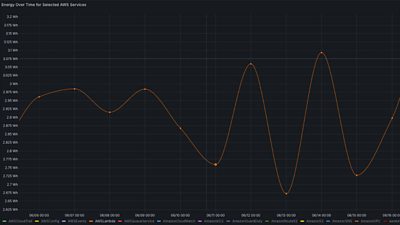
Teams have started to use this to identify areas where they can make improvements. Using the tool at project and cost-code levels, teams can track their energy performance and optimise their cloud energy consumption. For several products and services, benchmarking lets engineering teams look at performance from several perspectives, including, for example, hours spent by audiences on their product or service, or the usage of specific software platforms for internal operations. Total energy and emission estimates also help us rank the environmental impact of the cloud within the ��ѿ��ý’s overall footprint - and how to tackle this within an increasingly internet-based future.
Next steps
As the cloud remains critical for delivering digital operations, its sustainability remains a top priority for the ��ѿ��ý and organisations committed to sustainability targets. The failure of hyperscalers in not providing transparent energy estimates for cloud usage should not restrain enthusiastic engineers, product teams, and organisations from reducing their cloud-related environmental impacts.
Still, several challenges remain in accurate cloud energy estimates that can only be solved by closer participation from cloud providers. These include attributional decisions on service utilisation rates, hardware energy performance with increasing load, the case of resilience capacities, operational energy for data centre facilities, the influence of cloud on internet infrastructure and the embodied impacts of hardware beyond emissions. Until meaningful progress is made by the cloud industry, tools like LECCIE provide a reliable primer for teams that want to benchmark the energy footprints and sustainability progress of their cloud usage. Even though the energy estimates are not perfectly accurate, these tools are valuable until an accurate and transparent alternative is offered by cloud providers.
The ��ѿ��ý R&D Sustainable Engineering team can be contacted at sustainability@rd.bbc.co.uk.
Search by Tag:
- Tagged with Sustainability Sustainability
- Tagged with Internet Internet
- Tagged with Features Features